When you have a system with many moving parts it’s usually difficult trying to understand which one of those pieces is the culprit, say for instance your home page is taking 3 seconds to render and you’re losing customers, what the hell is going on?
Whether you’re using Memcache, Redis, RabbitMQ or a custom distributed service, if you’re trying to scale your shit up, you probably have many pieces or boxes involved.
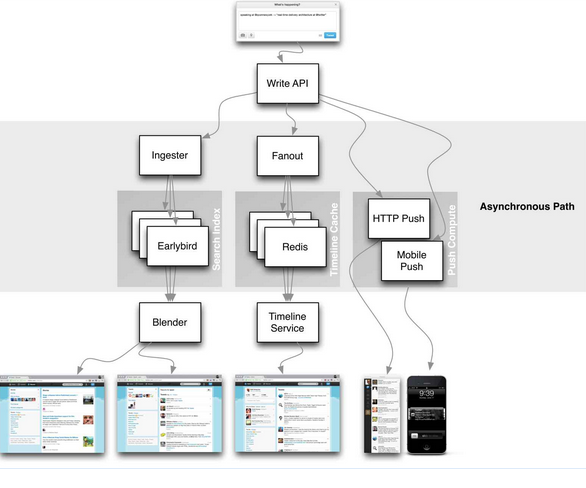
At least that’s what happens at Twitter, so they’ve come up with a solution called Zipkin to trace distributed operations, that is, an operation that is potentially solved using many different nodes.
Twitter Architecture

Having dealt with distributed logging in the past, reconstructing a distributed operation from logs, it’s like trying to build a giant jigsaw puzzle in the middle of a Tornado.
The standard strategy is to propagate some operation id and use it anywhere you want
to track what happened, and that is the essence of what Zipkin does, but in a structured kind of way.
Zipkin
Zipkin was modelled after Google Dapper paper on distributed tracing and basically gives you two things:
- Trace Collection
- Trace Querying
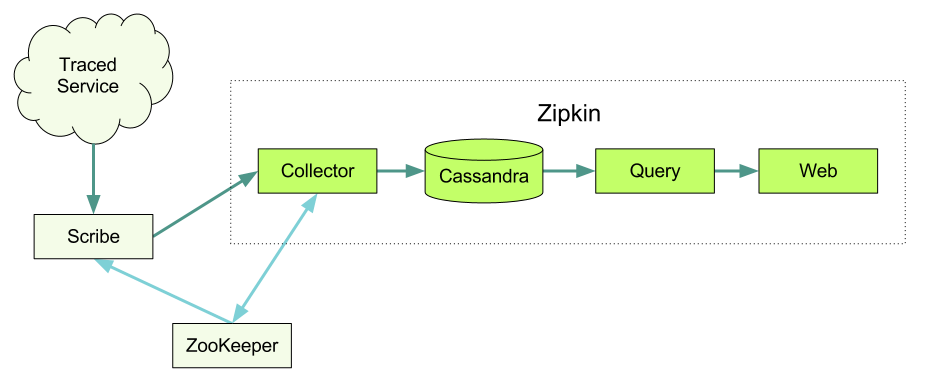
Zipkin Architecture

The architecture looks complex but it ain’t that much, since you can avoid using Scribe, Cassandra, Zookeeper
and pretty much everything related to scaling the tracing platform itself.
Since the trace collector speaks the Scribe protocol you can trace directly to the collector, and you can also use local disk storage for tracing and avoid a distributed database like Cassandra, it’s an easy way to get your feet wet without having to setup a cluster to peek a few traces.
Tracing
There are a couple entities involved in Zipkin tracing which you should know before moving forward:
Trace
A trace is a particular operation which may occur in many different nodes and be composed on many different Spans.
Span
A span represents a sub-operation for the Trace, it can be a different service or a different stage in the operation process. Also, spans have a hierarchy, so a span can be a child of another span.
Annotation
The annotation is how you tag your Spans to actually know what happened, there are two type of spans:
- Timestamp
- Binary
Timestamp spans are used for tracing time related stuff, and Binary annotations are used to tag your operation with a particular context, which is useful for filtering later.
For instance you can have a new Trace for each home page request, which decomposes in the Memcache Span the Postgres Span and the Computation Span, each of those with their particular Start Annotation and Finish Annotation.
API
Zipkin is programmed in Scala and uses thrift, since it’s assumed you’re going to have distributed operations, the official client is Finagle, which is kind of a RPC system for the JVM, but at least for me, it’s quite ugly.
Main reason is that it makes you feel that if you want to use Zipkin you must use a Distributed Framework, which is not at all necessary. For a moment I almost felt like Corba and DCOM were coming back from the grave trying to lure me into the abyss.
There’s also libraries for Ruby and Python but none of them felt quite right to me, for Ruby you either use Finagle or you use Thrift, but there’s no actual Zipkin library, for Python you have Tryfer which is good and Restkin which is a REST API on top of it.
Clojure
In the process of understanding what Zipkin can do for you (that means me) I hacked a client for Clojure using clj-scribe and clj-thrift which made the process almost painless.
It comes with a ring handler so you can trace your incoming requests out of the box.
1 2 3 4 5 6 7 8 9 10 | |
Zipkin Web Analyzer

It’s far from perfect, undocumented and incomplete, but at least it’s free :)
Give it a try and let me know what you think.
I’m guilespi at Twitter